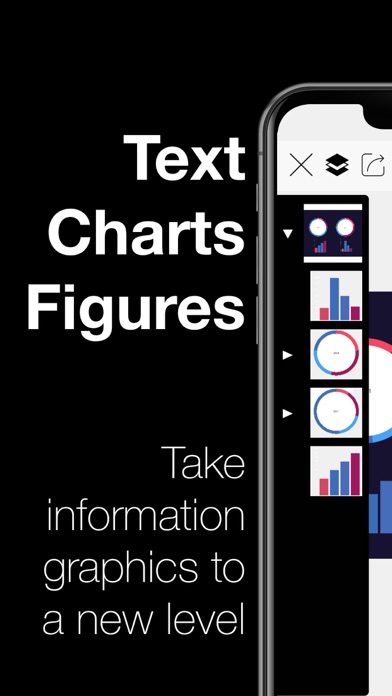
Infographer allows you to create information graphics in a new way.
You can select one of the different elements, in the element navigator, and create easy and awesome looking graphics.
Infographer support all these graphic types:
- bar charts
- pie charts
- line charts
- bubble charts
and a world map
All of them can be easily edited with the build in spreadsheet.
You can use a CSV file to add an data set. (only iOS)
Infographer support drawing with a pencil or other, for more customized elements in your projects.
A new image editing feature, that allows you to crop image and you can apply different predefinied filters. (only iOS 14+)
This app was create for easy and simple use, but with a variety of customization possibilities.
One of the main technological features of our app, is the usage of vector graphics, that allows you to create hight resolution images, drawings and graphs.
You can use drag and drop or file selector to add SVGs (without CSS) and other Images formats to the editor.
All pages you create can be exported as JPG or PNG.
You can use all your files across multiple device via build in File management over iCloud drive.
Infographer allows to create data visualizations, information designs or information architectures.
Infographer is pure native app, so all app functionalities are performant and can be used offline.
The new configuration (only iOS 14+)


